目 录 1 数据集 1
1 数据集 在本次作业中, 在 UCI 中选取了 Sonar 数据集进行分类, 该数据集具有 208 个样本,
2 logistic 回归与神经网络 由于 logistic 分类本质为线性求和以及激活函数的作用, 因此这里使用了神经网络框架来实现 logistic 回归, 即神经网络框架只有一个线性层, 然后使用 sigmoid 激活函数, 在结果的判定中对得到的结果进行分类, 即当结果大于 0.5 的时候为一类, 否则为另一类, 即可得出结果, 因此这两种方法同时实现了。
2.1 背景知识 2.1.1 线性及 sigmoid 函数 logistic 分类为一个线性求和和一个 sigmoid 激活组成,假设有一个 $n$ 维的输入列向量 $x$,也有一个 $n$ 维的参数列向量 $h$,还有一个偏置量 $b$ 那么就可以线性求和得到 $z_{\mathrm{s}}$:
$$
这个时候值的范围仍是 $({-}\infty, +\infty)$,无法判断出来分类,这个时候就需要一个激活函数来将值进行划分,这里使用的激活函数是 sigmoid 函数:
$$
其导数有以下规律:
$$
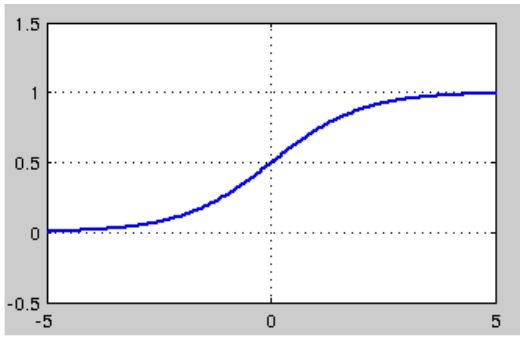
其图像如下图所示:
$$
这样进行判别,当 $a$ 大于 0.5 的时候,可以判定 $x$ 属于一类,否则属于另一类,即可进行分类。
2.1.2 计算误差及修正参数 在凸优化问题中, 可以通过导数为零进行计算。
图 1: sigmoid 函数图像
这种直接的计算在小规模情况下可行, 但在大规模数据以及非凸优化的情况下, 采用迭代的方法得到局部最优解的方式更加可行,即如下方法:
$$
$$
其中 $\eta$ 表示学习率,这里损失函数可以使用平方差损失。即 $C = \frac{1}{2}(a - y)$,并进行迭代,即可求出结果。
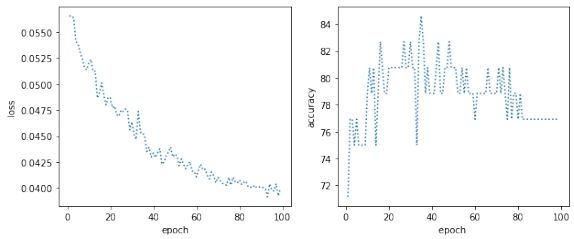
2.2 代码实现及结果分析 这里首先导入数据并将标签进行二值化, 然后利用 sklearn 来将数据进行划分, 得到训练集以及测试集。随后定义网络结构, 即仅有一个线性层并使用 sigmoid 激活函数的神经网络, 并将特征设置为数据的维度, 之后分别定义训练函数以及测试函数。然后将上文划分好的测试集以及训练集利用 TensorDataset 以及 DataLoader 得到可以送入神经网络的迭代器, 定义损失函数使用均方损失, 优化器这里使用了著名的不需要调参数的 Adadelta, 因为之前使用 SGD 的时候结果在参数调整不合适的情况会出现很大问题。最后训练并测试结果, 并将其可视化出来, 得到结果如下图所示:
图 2: logistic 分类结果
3 高斯判别分析 3.1 背景知识 高斯判别分析是一个比较直观的模型, 一个基本的假设就是得到的数据是独立同分布
$$
其中 $x$ 为样本特征, $\sigma$ 为标准差, $\mu$ 为样本期望值,并将该分布记为 $N(\mu, \sigma^2)$,当 $\mu = 0$,$\sigma = 1$ 时候的正态分布是标准正态分布。
$n$ 维正态分布表示为:
$$
其中 (p(x; \mu, \Sigma)) 中的 (\mu, \Sigma) 分别表示均值向量以及协方差矩阵。
将 (n) 维高斯分布应用到监督学习中,假设输入数据为 (x),输出类别为 (y \in {0,1}),则对应分类问题可以描述为:
$$
$$
$$
其中 Bernoulli((\phi)) 表示伯努利分布,通过推导可以得出样本分类的依据:
$$
$$
$$
3.2 代码实现 首先求出训练数据的均值向量以及协方差矩阵, 然后利用公式分布求出正负样本的概
4 贝叶斯分类 4.1 背景知识 贝叶斯分类是一类分类算法的总称, 一类算法以贝叶斯定理为基础, 统称为贝叶斯分类。朴素贝叶斯是贝叶斯分类中最简单常见的一种分类方法。理论上朴素贝叶斯模型比其他分类方法误差率更小, 但是由于朴素贝叶斯模型假设属性之间相互独立, 但是这个假设在实际中往往不成立, 在属性个数多或者属性相关性较大的时候, 分类效果差。朴素贝叶斯逻辑简单, 易于实现, 而且分类过程中开销比较小, 其核心算法是贝叶斯公式:
4.2 代码实现 这里首先定义一个 gaussion_pdf 函数,这个函数的作用就是利用 (n) 维正态分布的公式,从而求得 (n) 维正态分布的分布情况,从而为预测函数提供概率基础,然后定义一个预测函数 predict,利用 numpy 的 unique 求得分类数,并对每一类分布,求得 (P(y)) 以及 (P(x {\mid} y)) ,最后将测试集传入,并与测试集的标签对比得出结果。
5 性能分析 从性能上来说, 贝叶斯分类开销比较小, 而 logistic 神经网络法则比较大, 这是因为神经网络使用的空间等相对较大, 而贝叶斯由于采用的仅为样本空间, 因此性能相对较好。
6 时效分析 代码中已经利用了库函数 time 来计算程序运行的时间, 经过测试, logistic 分类经过 100 次迭代使用的时间为 $2.35\mathrm{\ s}$ ,而高斯判别分析用时为 $0.02\mathrm{\ s}$ ,贝叶斯分类用时 $0.01\mathrm{\ s}$ ,调用的贝叶斯分类函数,其用时同样为 $0.01\mathrm{\ s}$ 。
logistic 分类
贝叶斯分类
GDA 分类
时间复杂度
$\theta(m \cdot k)$
$\theta(m)$
$\theta(m \cdot d)$
空间复杂度
$\theta(d)$
$\theta(d \cdot K)$
$\theta(d^{2})$
其中 $m$ 为样本数, $d$ 为特征维数, $k$ 为迭代次数。
7 影响因素分析 7.1 logistic 分类 在这个方法中, 我在写的过程中遇到的一个问题就是优化器的选取, 在开始使用 SGD 的时候, 损失在很短的时间就达到很大, 显示出 nan, 经过多次尝试才明白出问题的地方, 修改后, 效果较好。
8 总结 在这次的机器学习大作业中我收获很大, 这次的作用并不容易, 不仅仅要完成三个方法的分类任务, 一个重要方面是对方法的分析, 包括性能分析, 时效分析等, 这也是对能力的一次锻炼, 收获很大。
参考文献 [1] 详解朴素贝叶斯分类算法 https://blog.csdn.net/ccblogger/article/details/81712351 ? ivk_sa=1024320u
[2] 贝叶斯分类
[3] 高斯判别分析
A logistic 分类代码
1 2 3 4 5 6 7 8 9 10 11 12 13 14 15 16 17 18 19 20 21 22 23 24 25 26 27 28 29 30 31 32 33 34 35 36 37 38 39 40 41 42 43 44 45 46 47 48 49 50 51 52 53 54 55 56 57 58 59 60 61 62 63 64 65 66 67 68 69 70 71 72 73 74 75 76 77 78 79 80 81 82 83 84 85 86 87 88 89 90 91 92 93 94 95 96 97 98 99 100 101 102 103 104 105 106 107 108 109 110 111 112 113 """ Created on Sat Apr 10 16:56:09 2021 @author: tremble """ import torchimport torch.nn as nnimport torch.optim as optimimport numpy as npimport pandas as pd from sklearn.model_selection import train_test_splitimport matplotlib.pyplot as pltimport timestart=time.time() file=pd.read_csv('D:/桌面/sonar.csv' ,header=None ) data=file.iloc[:,:40 ] target=file.iloc[:,-1 ] data=np.array(data,dtype=float ) target=pd.get_dummies(target).iloc[:,0 ] data=torch.tensor(data,dtype=torch.float ) target=torch.tensor(target,dtype=torch.float ) x_train,x_test,y_train,y_test=train_test_split(data,\ target,test_size=0.25 ,random_state=5 ) class logistic_net (nn.Module): def __init__ (self,features ): super (logistic_net,self).__init__() self.linear=nn.Linear(features,1 ) def forward (self,x ): x=self.linear(x) x=torch.sigmoid(x) x = x.squeeze(-1 ) return x model=logistic_net(40 ) def train (model, train_loader, optimizer, epoch, criterion ): model.train() loss = 0.0 for i, (data, target) in enumerate (train_loader): optimizer.zero_grad() output = model(data) loss = criterion(output, target) loss.backward() optimizer.step() if i % 10 == 0 : print ('Train Epoch: {} [{}/{} ({:.0f}%)]\tLoss: {:.6f}' .format ( epoch, i * len (data), len (train_loader.dataset), 100. * i / len (train_loader), loss.item())) def test (model,test_loader, criterion ): model.eval () test_loss = 0 correct = 0 with torch.no_grad(): for data, target in test_loader: pred=torch.Tensor(len (target),1 ) output = model(data) test_loss += criterion(output, target).item() for i in range (len (target)): if output[i]>0.5 : pred[i]=torch.tensor(1 ) else : pred[i]=torch.tensor(0 ) correct += pred.eq(target.view_as(pred)).sum ().item() test_loss /= len (test_loader.dataset) print ('\nTest set: Average loss: {:.4f}, Accuracy: {}/{} ({:.0f}%)\n' .format ( test_loss, correct, len (test_loader.dataset), 100. * correct / len (test_loader.dataset))) return test_loss,100. * correct / len (test_loader.dataset) trainset=torch.utils.data.TensorDataset(x_train,y_train) testset=torch.utils.data.TensorDataset(x_test,y_test) trainloader=torch.utils.data.DataLoader(trainset,batch_size=4 ,shuffle=True ) testloader=torch.utils.data.DataLoader(testset,batch_size=4 ,shuffle=True ) criterion = nn.MSELoss() optimizer = optim.Adadelta(model.parameters(), lr=1.0 ) epoch_list,ls_list,accuracy_list=[],[],[] for epoch in range (1 , 100 ): train(model,trainloader, optimizer, epoch, criterion) ls,accuracy=test(model, testloader, criterion) epoch_list.append(epoch) ls_list.append(ls) accuracy_list.append(accuracy) fig = plt.figure(figsize=(10 ,4 )) plt.subplot(121 ) plt.plot(epoch_list,ls_list,linestyle=':' ) plt.xlabel('epoch' ) plt.ylabel('loss' ) plt.subplot(122 ) plt.plot(epoch_list,accuracy_list,linestyle=':' ) plt.xlabel('epoch ' ) plt.ylabel('accuracy' ) plt.show() print ('用时{:.2f}s' .format (time.time()-start))
B GDA 分类代码
1 2 3 4 5 6 7 8 9 10 11 12 13 14 15 16 17 18 19 20 21 22 23 24 25 26 27 28 29 30 31 32 33 34 35 36 37 38 39 40 41 42 43 44 45 46 47 48 49 50 51 52 53 54 55 56 57 58 59 60 61 62 63 64 65 66 67 68 69 70 71 72 73 74 75 76 77 78 79 80 81 82 83 84 85 86 87 88 89 90 91 92 93 """ Created on Sat Apr 10 18:11:49 2021 @author: tremble """ import numpy as npimport pandas as pd from sklearn.model_selection import train_test_splitimport time start=time.time() file=pd.read_csv('D:/桌面/sonar.csv' ,header=None ) data=file.iloc[:,:40 ] target=file.iloc[:,-1 ] data=np.array(data,dtype=float ) target=pd.get_dummies(target).iloc[:,0 ] x_train,x_test,y_train,y_test=train_test_split(data,\ target,test_size=0.25 ,random_state=5 ) positive_data=[] negative_data=[] positive_num=0 negative_num=0 for (data,label)in zip (x_train,y_train): if label ==1 : positive_data.append(list (data)) positive_num+=1 else : negative_data.append(list (data)) negative_num+=1 row,col=np.shape(x_train) positive=positive_num*1.0 /row negative=1 -positive positive_data=np.array(positive_data) negative_data=np.array(negative_data) mean_positive=np.mean(positive_data,axis=0 ) mean_negative=np.mean(negative_data,axis=0 ) positive_deta=positive_data-mean_positive negative_deta=negative_data-mean_negative sigma=[] for deta in positive_deta: deta=deta.reshape(1 ,col) ans = deta.T.dot(deta) sigma.append(ans) for deta in negative_deta: deta=deta.reshape(1 ,col) ans = deta.T.dot(deta) sigma.append(ans) sigma=np.array(sigma) sigma=np.mean(sigma,axis=0 ) mean_positive=mean_positive.reshape(1 ,col) mean_negative=mean_negative.reshape(1 ,col) def Gaussian (x,mean,cov ): dim=np.shape(cov)[0 ] covdet = np.linalg.det(cov + np.eye(dim) * 0.001 ) covinv = np.linalg.inv(cov + np.eye(dim) * 0.001 ) xdiff = (x - mean).reshape((1 , dim)) prob = 1.0 / (np.power(np.power(2 * np.pi, dim) *\ np.abs (covdet), 0.5 )) * \ np.exp(-0.5 * xdiff.dot(covinv).dot(xdiff.T))[0 ][0 ] return prob def predict (x_test,mean_positive,mean_negetive ): predict_label=[] for data in x_test: positive_pro=Gaussian(data, mean_positive, sigma) negative_pro=Gaussian(data, mean_negetive, sigma) if positive_pro>=negative_pro: predict_label.append(1 ) else : predict_label.append(0 ) return predict_label test_predict=predict(x_test,mean_positive,mean_negative) test_predict=np.array(test_predict) y_test=np.array(y_test) accuracy=(test_predict==y_test).sum ().item()/len (y_test) print ('用时{:.2f}s,准确率为{:.2f}%' .\ format (time.time()-start,accuracy*100.0 ))
C 贝叶斯分类代码
1 2 3 4 5 6 7 8 9 10 11 12 13 14 15 16 17 18 19 20 21 22 23 24 25 26 27 28 29 30 31 32 33 34 35 36 37 38 39 40 41 42 43 44 45 46 47 48 """ Created on Sat Apr 10 18:36:49 2021 @author: tremble """ import numpy as npimport pandas as pd from sklearn.model_selection import train_test_splitimport timestart=time.time() file=pd.read_csv('D:/桌面/sonar.csv' ,header=None ) data=file.iloc[:,:40 ] target=file.iloc[:,-1 ] data=np.array(data,dtype=float ) target=pd.get_dummies(target).iloc[:,0 ] data=np.array(data,dtype=float ) target=np.array(target,dtype=float ) x_train,x_test,y_train,y_test=train_test_split(data,\ target,test_size=0.25 ,random_state=5 ) def gaussion_pdf (x_test, x ): temp1 = (x_test - x.mean(0 )) * (x_test - x.mean(0 )) temp2 = x.std(0 ) * x.std(0 ) return np.exp(-temp1 / (2 * temp2)) / np.sqrt(2 * np.pi * temp2) def predict (x_train,y_train,x_test ): assert len (x_test.shape) == 2 classes = np.unique(y_train) pred_probs = [] for i in classes: idx_i = y_train == i p_y = len (idx_i) / len (y_train) p_x_y = np.prod(gaussion_pdf(x_test,x_train[idx_i]), 1 ) prob_i = p_y * p_x_y pred_probs.append(prob_i) pred_probs = np.vstack(pred_probs) label_idx = pred_probs.argmax(0 ) y_pred = classes[label_idx] return y_pred y_predict=predict(x_train,y_train,x_test) accuracy=(y_predict==y_test).sum ().item()/len (y_test) print ('准确率为{:.2f}%,用时{:.2f}s' .format (accuracy*100.0 ,\ time.time()-start))
D 贝叶斯库函数调用分类代码
1 2 3 4 5 6 7 8 9 10 11 12 13 14 15 16 17 18 19 20 21 22 23 24 25 26 27 28 29 30 31 32 33 """ Created on Sat Apr 10 19:53:00 2021 @author: tremble """ from sklearn.metrics import accuracy_scorefrom sklearn.naive_bayes import GaussianNBimport timeimport pandas as pdimport numpy as npfrom sklearn.model_selection import train_test_splitstart=time.time() file=pd.read_csv('D:/桌面/sonar.csv' ,header=None ) data=file.iloc[:,:40 ] target=file.iloc[:,-1 ] data=np.array(data,dtype=float ) target=pd.get_dummies(target).iloc[:,0 ] data=np.array(data,dtype=float ) target=np.array(target,dtype=float ) x_train,x_test,y_train,y_test=train_test_split(data,\ target,test_size=0.25 ,random_state=5 ) model = GaussianNB() model.fit(x_train,y_train) test_predict_model = model.predict(x_test) print ("逻辑回归的正确率为:{:.2f}%,用时为{:.2f}s" .\ format (accuracy_score(y_test,\ test_predict_model)*100.0 ,time.time() - start))


